The 10-year, the curve and inflation every Monday for real estate
Agents, brokers and small investors get asked where rates are going. Curvewire shows where they are and how they moved, from the Treasury and BLS files, without opinion.
How real estate teams use Curvewire Brief
- Check the 10y yield and its weekly change at the top of the curve table.
- Look at CPI and core CPI year on year in the macro dashboard.
- Use the 52-week range to put this week in context for a client.
- Keep the CSVs to chart the trend over the months.
In the 27 Sep 2026 edition the 10y was 5.17%, up 97 bp in 52 weeks, and CPI was 3.4% year on year (August 2026).
General information only, not financial advice.
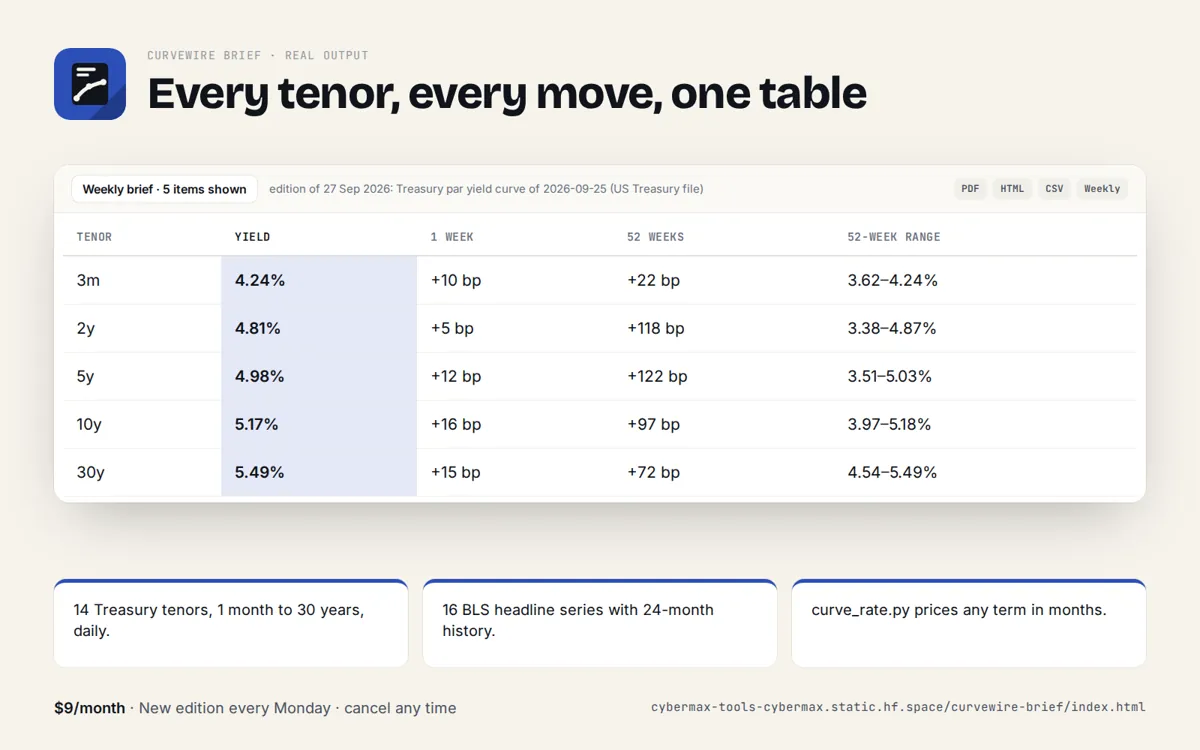
Edition of 27 Sep 2026: Treasury par yield curve of 25 Sep 2026
| Tenor | Yield | 1 week | 52 weeks | 52-week range |
|---|---|---|---|---|
| 3m | 4.24% | +10 bp | +22 bp | 3.62-4.24% |
| 2y | 4.81% | +5 bp | +118 bp | 3.38-4.87% |
| 5y | 4.98% | +12 bp | +122 bp | 3.51-5.03% |
| 10y | 5.17% | +16 bp | +97 bp | 3.97-5.18% |
| 30y | 5.49% | +15 bp | +72 bp | 4.54-5.49% |
Source: Curvewire Brief edition of 27 Sep 2026 (products/curvewire-brief/store/listing.json and web/sample.json), from the US Treasury daily par yield curve file of 2026-09-25.
FAQ
Does it include mortgage rates?
No. It covers Treasury yields, TIPS breakevens and BLS series; mortgage rates are not in those files.
Why not a free markets newsletter?
Those mix news and opinion. This is the agencies' numbers, organised the same way every week.
Curvewire Brief: full guide with prices and alternatives · All use cases · Store